
Whether you’re trading Bitcoin, Ethereum, or altcoins, understanding how to read crypto charts is one of the most important skills you can develop. Charts tell a story — they reflect market sentiment, show price movements, and help traders make informed decisions.
If you’ve ever opened a trading app and felt overwhelmed by candlesticks, indicators, and lines going up and down, this guide is for you. We’ll walk through the essentials, from chart types to technical indicators, and teach you how to start analyzing crypto markets like a pro — even if you’re just getting started.
1. Understanding Chart Basics
At its core, a crypto chart is a visual representation of price data over time. The most common chart type you’ll encounter is the candlestick chart, but there are others too, like line and bar charts. However, candlesticks are favored due to the amount of data they convey visually.
Candlestick Breakdown:
- Body: The rectangle between open and close prices
- Wick (or shadow): The line extending above/below the body showing the high and low prices
- Color:
- Green (or white): Price went up during the time frame (close > open)
- Red (or black): Price went down (close < open)
Each candle reveals four key pieces of data: open, high, low, and close (OHLC), giving traders a compact snapshot of price behavior.
2. Time Frames Matter
Crypto charts can be viewed in various time frames. Which one you choose depends on your goals and trading style.
Common Time Frames:
- 1-minute to 15-minute: For scalping or very short-term trades
- 1-hour and 4-hour: For intraday and swing trades
- 1-day, 1-week, 1-month: For long-term investors and trend analysis
Switching between time frames can help validate signals or identify conflicting trends. For example, a bullish pattern on the daily chart might contrast with short-term noise on the 5-minute chart.
3. Support and Resistance
Support and resistance are foundational concepts in technical analysis. They mark key price levels where supply and demand dynamics shift.
- Support is like a floor. It’s a price level where buying interest tends to halt downward moves.
- Resistance is like a ceiling. It’s a price point where selling pressure tends to cap upward movement.
How to Identify:
- Look for areas where price has previously reversed or consolidated
- Use horizontal lines or zones, not exact prices
- Higher time frames often offer more reliable support/resistance levels
Support and resistance can also become each other — when broken, resistance can become support and vice versa.
4. Trendlines and Patterns
Trendlines help visualize the overall direction of the market.
- Uptrend: Higher highs and higher lows
- Downtrend: Lower highs and lower lows
- Sideways / Range-bound: Horizontal price movement between support and resistance
Popular Chart Patterns:
- Head and Shoulders: Signals trend reversals
- Double Top / Bottom: Indicates failed breakouts or reversal signals
- Triangles: Show a tightening price range — can precede breakouts
- Flags and Pennants: Continuation patterns that often follow strong price moves
Learn to recognize these patterns as they appear. They don’t always play out exactly as expected, but they give structure to the price action.
5. Indicators and Tools
Technical indicators help traders interpret chart data and build strategies. Each serves a different purpose:
Trend Indicators:
- Moving Averages (MA): Helps smooth price data. Simple (SMA) and Exponential (EMA) are common types.
- MACD: Measures momentum and identifies trend reversals with signal line crossovers.
Momentum Indicators:
- RSI (Relative Strength Index): Measures how quickly price moves. Overbought = above 70, oversold = below 30.
- Stochastic RSI: Offers a faster, more sensitive version of RSI.
Volume Indicators:
- On-Balance Volume (OBV): Combines price and volume to gauge strength of a trend.
- Volume Bars: Visualize how much of an asset was traded during a candle’s time frame.
Volatility Indicators:
- Bollinger Bands: A moving average with bands that expand/contract with volatility.
Using multiple indicators in conjunction can provide better confirmation for trades — but avoid “analysis paralysis” by crowding your chart.
6. Candlestick Patterns
Beyond chart-wide patterns, individual candlesticks or clusters can offer valuable insight.
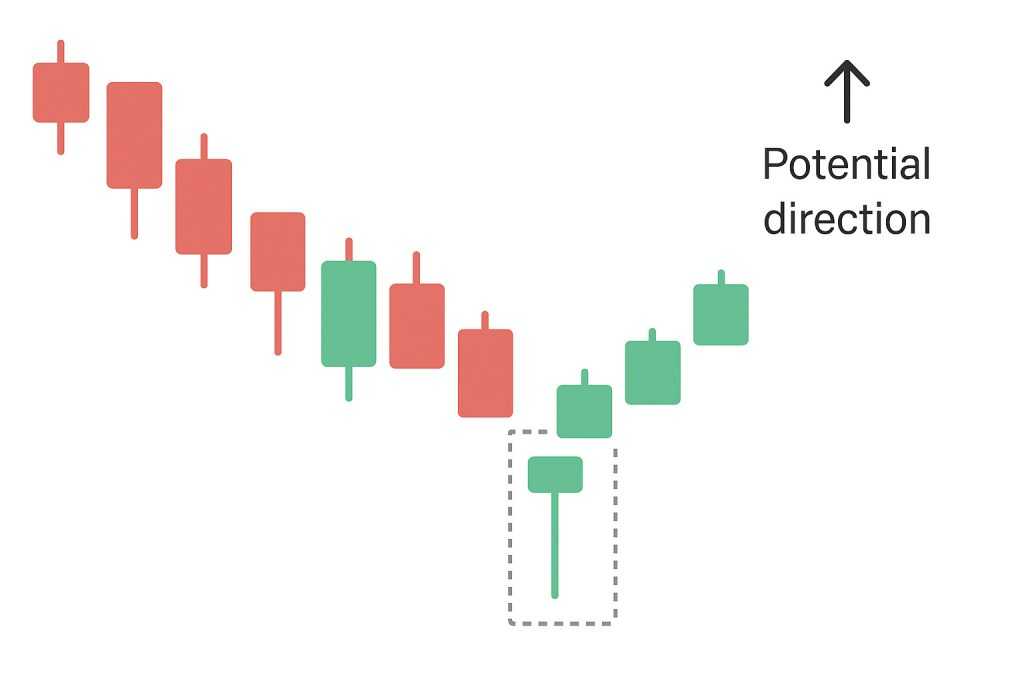
Reversal Candlesticks:
- Doji: Indecision; could indicate a reversal if it appears after a strong trend
- Hammer: Bullish reversal if found at the bottom of a downtrend
- Shooting Star: Bearish reversal pattern at the top of an uptrend
Continuation Candlesticks:
- Marubozu: A strong move without wicks; often signals momentum
- Engulfing Patterns: When one candle fully “engulfs” the previous one, signaling strength
Candlestick patterns are most reliable when confirmed by volume or broader chart context.
7. Reading the Order Book (Bonus Skill)
For traders using exchanges with live order books, understanding the bid/ask spread and order depth is crucial.
- Bid: Prices buyers are willing to pay
- Ask: Prices sellers want
- Spread: The difference between highest bid and lowest ask
Order books can help:
- Spot buy walls (large bids) and sell walls (large asks)
- Gauge short-term liquidity and market depth
- Predict potential reversals when walls are repeatedly tested
8. Fibonacci Retracement and Extensions
The Fibonacci tool is widely used to predict support and resistance levels based on ratios derived from the Fibonacci sequence.
Common Retracement Levels:
- 23.6%, 38.2%, 50%, 61.8%, 78.6%
Traders use these levels to anticipate pullbacks and continuation points. Fibonacci extensions help project how far price might go beyond its current swing.
Combine this tool with trendlines and volume to strengthen your predictions.
9. Practical Tips for Chart Reading
- Start with a clean chart — remove clutter and focus on price
- Identify trend first, then add indicators to support your view
- Set alerts at key levels to avoid missing trade setups
- Backtest strategies using historical data
- Journal your trades to refine your approach
Reading charts is like learning a new language — it takes time, repetition, and context. Don’t be afraid to start small.
Final Thoughts
Crypto charts are more than just colorful visuals — they’re a powerful tool for understanding market dynamics. Whether you’re investing for the long term or actively trading, chart literacy will help you make more confident and informed decisions.
There’s no perfect chart or magical indicator. But by developing your chart-reading skills, you’ll improve your timing, avoid common mistakes, and spot opportunities with greater precision.
Remember, consistency and discipline matter more than complexity.
Disclaimer: This guide is for informational purposes only and does not constitute financial or trading advice. Always do your own research.

Mihajlo Tošić is a content writer specializing in iGaming, crypto, and Web3. He focuses on clear, direct writing that helps brands explain, sell, or promote what they do — without overcomplicating things.


